Legal
Terms of Use
Last updated: January 2025 · Governed by German law
Nivvuro is not a financial advisor. Nothing on this platform constitutes investment advice, a solicitation, or a recommendation to buy or sell any financial instrument. All data is provided for informational and research purposes only.
1. The Analysis Platform
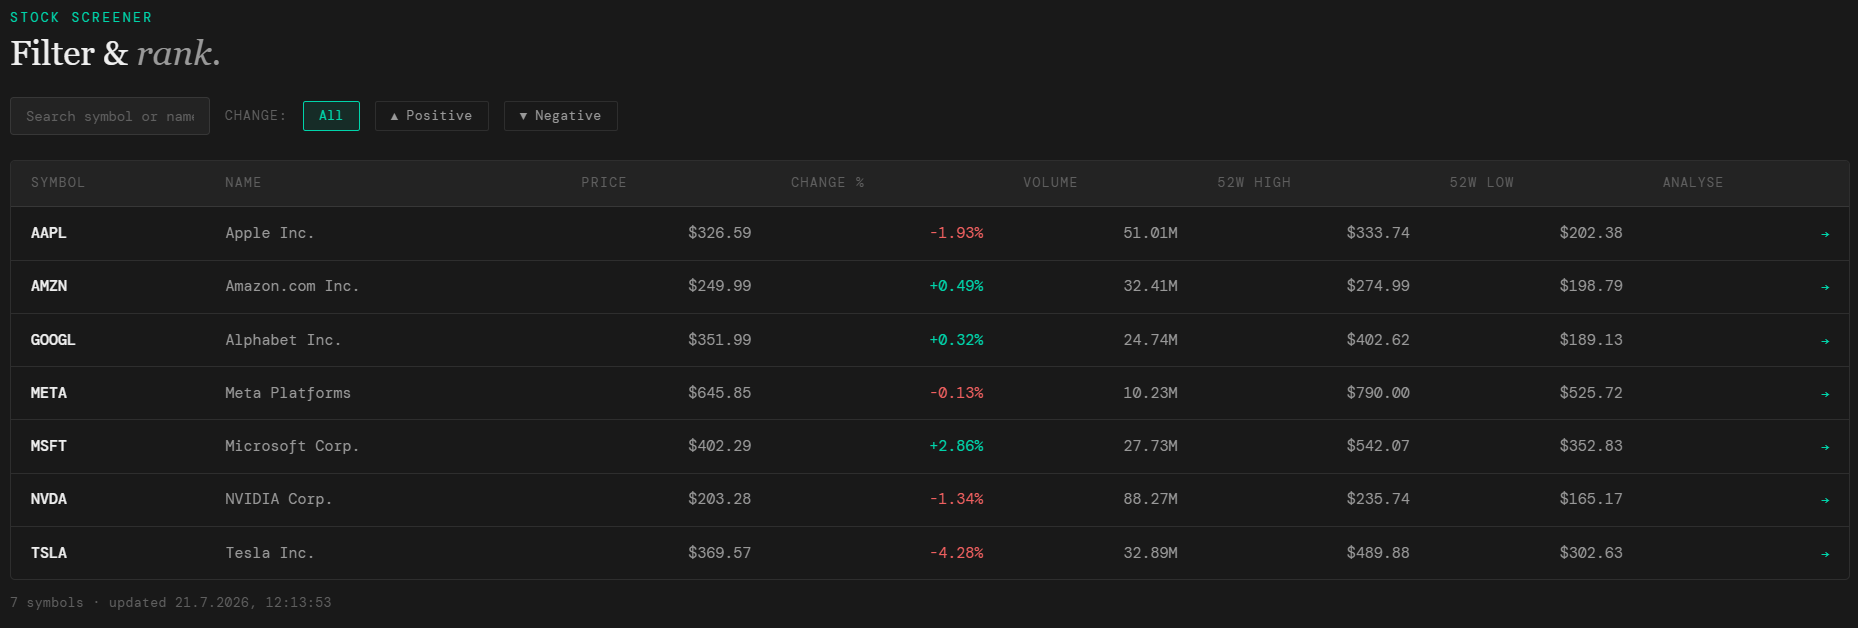
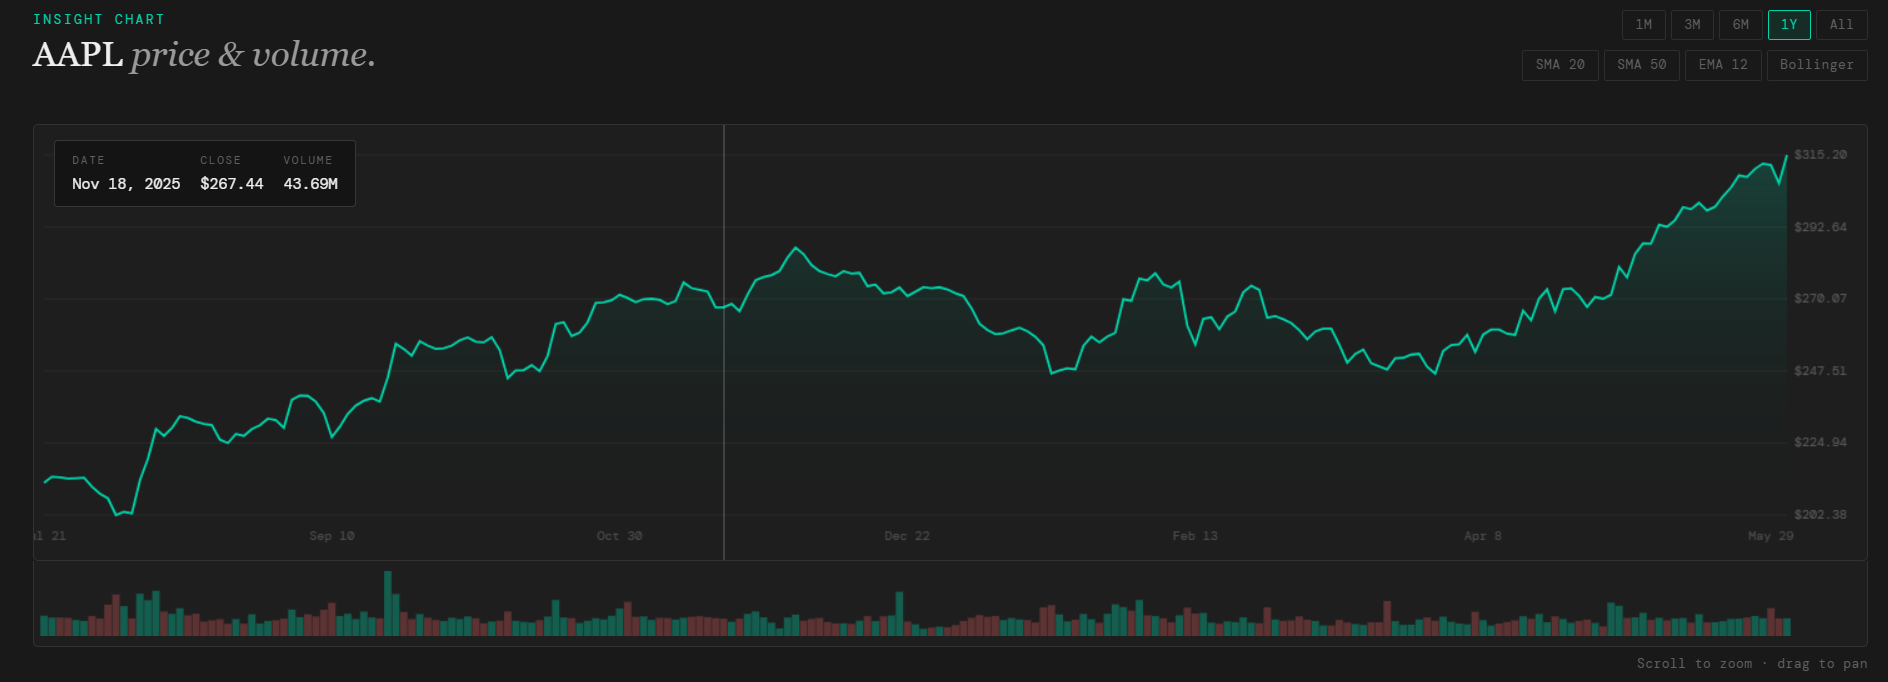
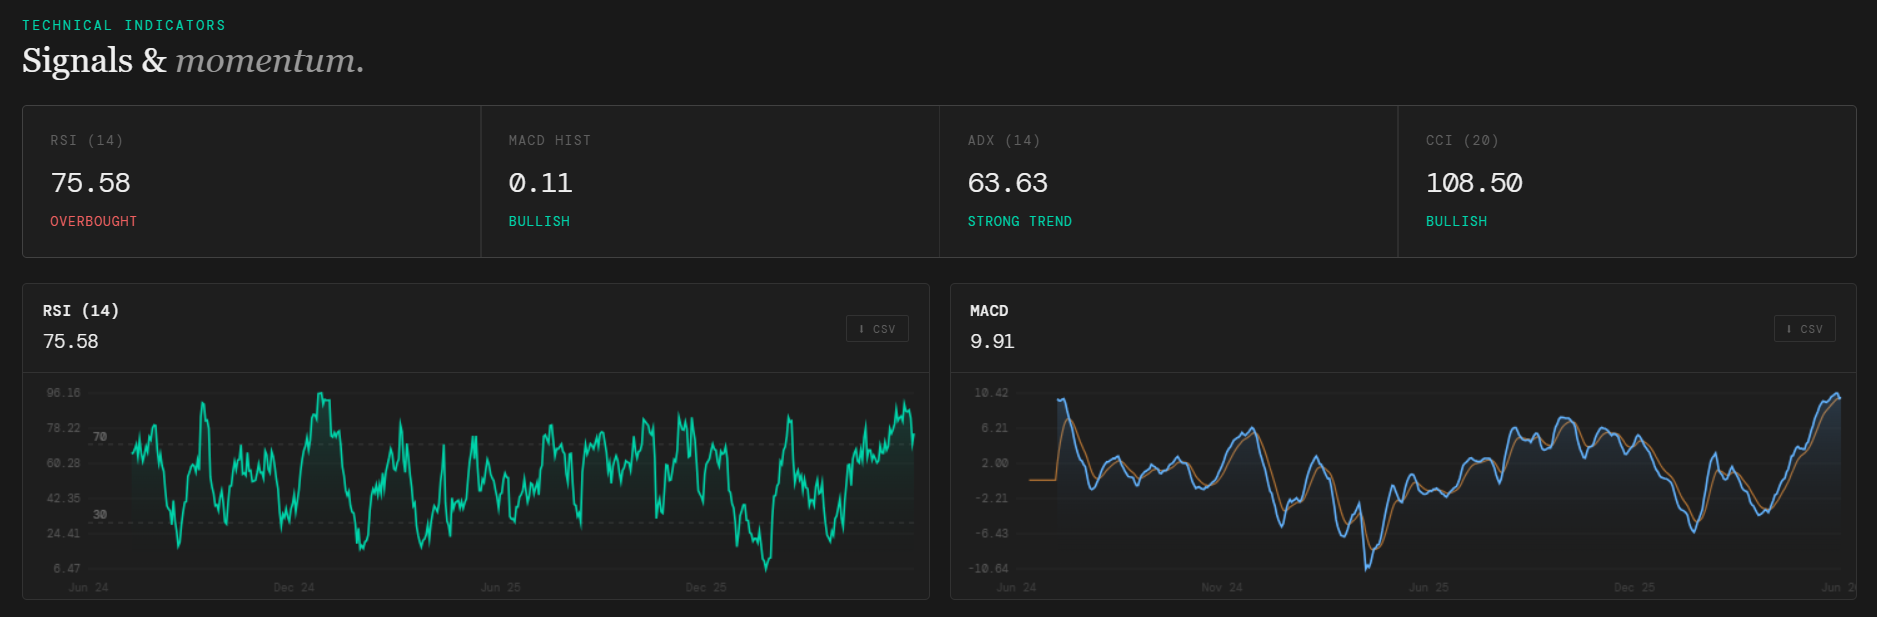
The Nivvuro analysis platform — including all technical indicators, risk metrics, SEC fundamentals, stock screener, and charting tools — is free to use, permanently.No credit card is required. No features are locked behind a paywall.
This will not change. The free platform is a core part of what Nivvuro is, not a trial or a limited version.
2. Paid Datasets
Structured financial datasets — fundamental and macroeconomic alike — are available for purchase at a one-time price only. There are no subscriptions, recurring charges, or hidden fees at the dataset level. Upon successful payment you receive an immediate download link via email and on the confirmation page.
Permitted use: Purchased datasets may be used for personal research, academic work, school and university projects, journalistic research, and the development of non-commercial tools and analyses.
Prohibited use: Reselling, redistributing, sublicensing, or incorporating Nivvuro datasets into commercial products or services for sale is not permitted without prior written consent.
2a. Fundamentals API
The Fundamentals API provides programmatic, continuously updated access to fundamental data across USA, South Korea, Japan, United Kingdom, France and the Netherlands, offered in four tiers (Free, Basic, Pro, Enterprise) as described on the Data & Pricing page. This is the only part of Nivvuro that involves a recurring subscription — no dataset itself is sold on a subscription basis.
Commercial use: The Free and Basic tiers are licensed for personal, educational, and non-commercial use only. Commercial use — including use in a product, service, or tool made available to third parties — is permitted starting with the Pro tier.
Rate limits: Each tier is subject to a fixed number of API calls per day or month as published on the pricing page. Exceeding the limit may result in throttled or rejected requests until the next billing period.
Billing and cancellation: Paid tiers (Basic, Pro) are billed monthly via Stripe Subscriptions and can be cancelled at any time, effective at the end of the current billing period. Enterprise terms are agreed individually by contract.
Right of withdrawal: Because a subscription constitutes a continuing obligation (Dauerschuldverhältnis) rather than an immediately delivered one-time digital product, the standard 14-day right of withdrawal under § 355 BGB applies to the first billing period of paid tiers.
3. No Refunds — One-Time Files
Because datasets are delivered digitally and immediately upon purchase, refunds are not available once the download link has been issued. This is consistent with §356 Abs. 5 BGB (German Civil Code) regarding the right of withdrawal for digital content.
A free sample dataset (AAPL, 5 rows, JSON + Excel) is available before any purchase to verify format compatibility. Please use it to confirm the data meets your needs before buying.
Exception: if a purchased dataset contains a verified technical error (missing fields, corrupted file), a corrected version will be delivered at no charge.
4. Intellectual Property
The following are the exclusive property of Nivvuro and its creator:
- The name and brand identity Nivvuro
- The website design, layout, and visual identity
- The source code of the platform and website
- The data normalization logic, schema, and methodology
- All written content, copy, and the Manifesto
The underlying raw data (SEC filings, FRED series, ECB data) is sourced from public domain databases and remains the property of the respective issuing authorities.
5. Disclaimer
Nivvuro provides data as-is, sourced from public authorities (SEC EDGAR, FRED, ECB). While we normalize and verify data, we cannot guarantee completeness or accuracy for all periods and all companies. Discrepancies are always traceable to the original filing.
Financial data displayed on the platform or sold as datasets does not constitute investment advice. Decisions made on the basis of Nivvuro data are the sole responsibility of the user.
6. Governing Law
These terms are governed by the laws of the Federal Republic of Germany. Place of jurisdiction is Germany. If individual provisions of these terms are invalid, the remaining provisions remain unaffected.